The biggest challenge is the processing of the large volume of data generated by the vehicles which are equipped with GPS satellite tracking from where the trajectories arise and their transformation into trips and stops.
Although it may seem trivial, it is not because these trajectories must be analyzed and processed “on the fly” with a Sequential analysis between points, to obtain relevant information, to recognize patterns and to be able to effectively distinguish, for example, a stop at a traffic light Or a real stop on a client and thus feed back the quantization thread.
As a quantifying data it can be mentioned that a single vehicle can generate more than 1500 positions during a day which multiplied by the number of vehicles and by the detail of data included with each position represents an important volume to be processed daily.
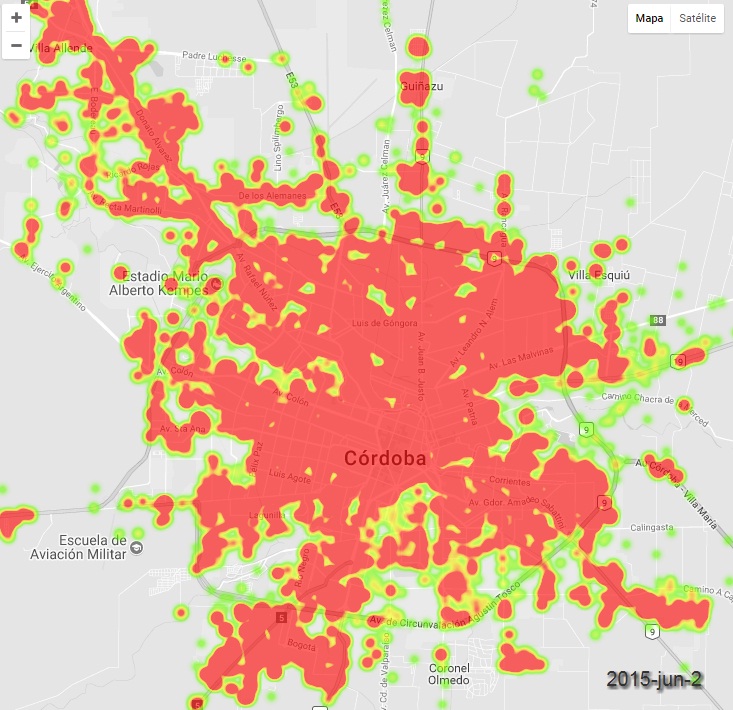
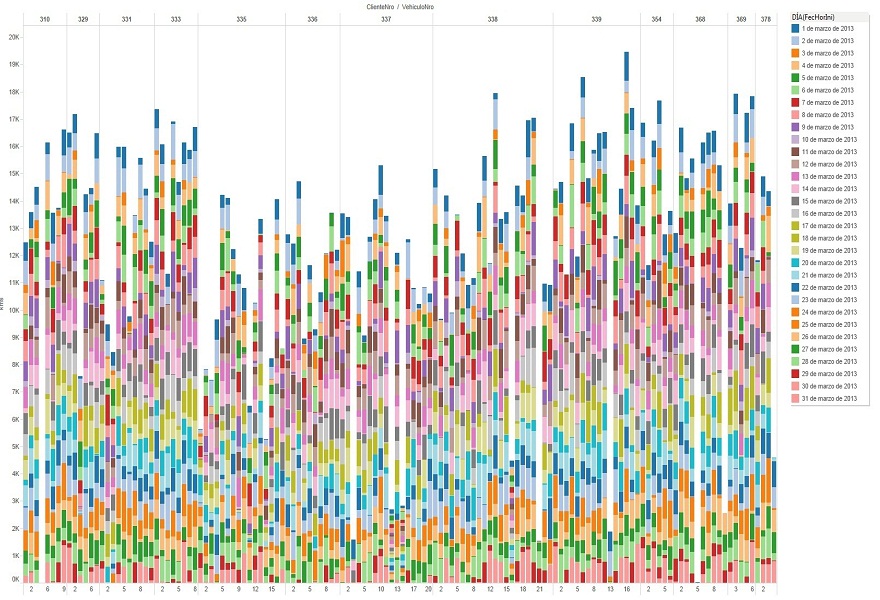
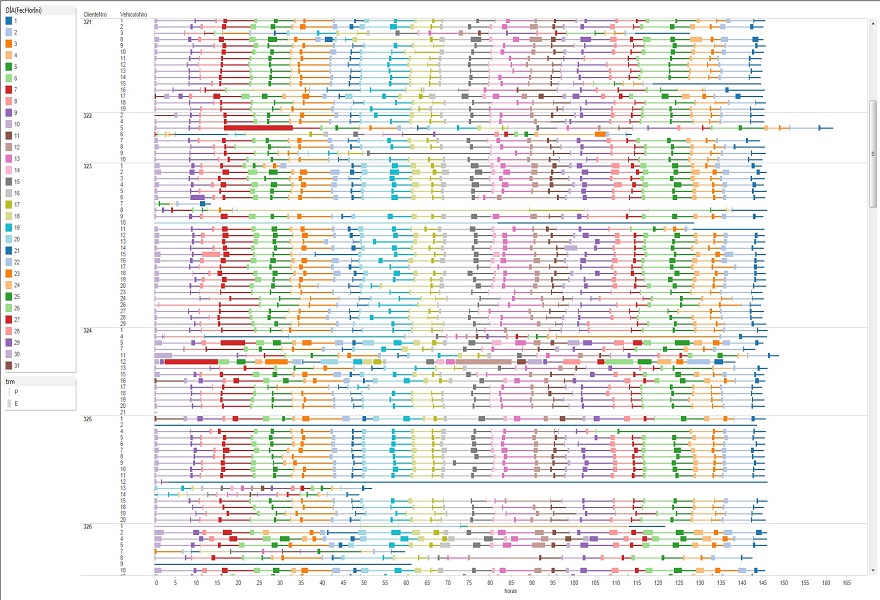
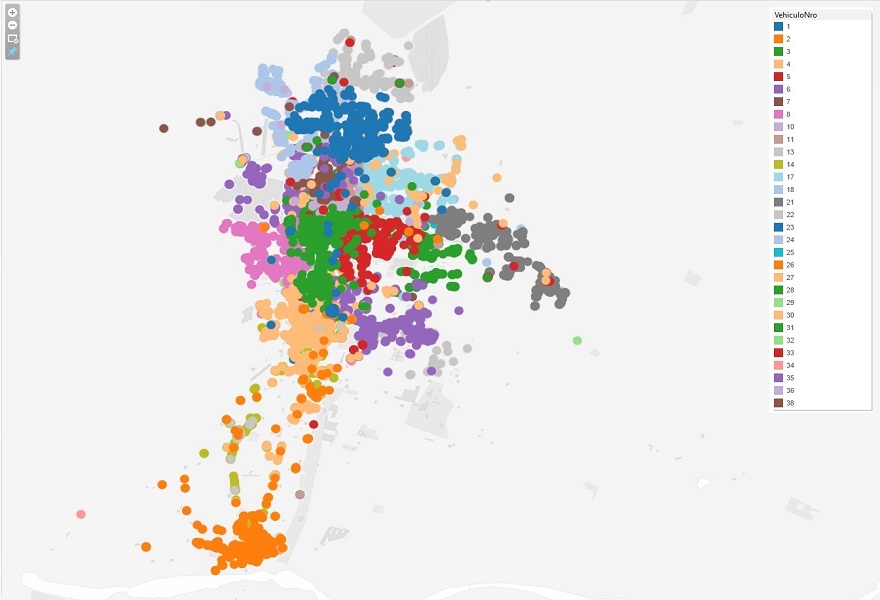
Once obtained the trips and distinguished each of its times and partial kilometers, it is proceeded to feed the generators of graphics that allow to visualize the information grouping it of different form to obtain the relevant indicator data. As can be seen in the graphs these can be temporary, distance, density or distribution by zones. It can also be known which vehicles are affected by each zone and how they are covered over time.
The development required background processing and the use of NO SQL database, some of its main advantages were key to carry out this project as Scalability and its decentralized nature.
Optimizing database queries for large amounts of data allows you to adapt to project needs much more easily than Relational Entity models.
Finally, in the hands of Google, and its Google Maps service, we can have the ability to view and interact with the information on the maps in an agile way. Knowing the location of a given address on a map and getting the shortest route between two points are tasks that are currently possible with some ease and were key in the project.
However, geospatial applications can perform even more complex tasks. Urban planning, analysis of hydrological networks, detection of natural resources, environmental monitoring and the delimitation of risk areas are examples of some of these tasks that can be carried out.


